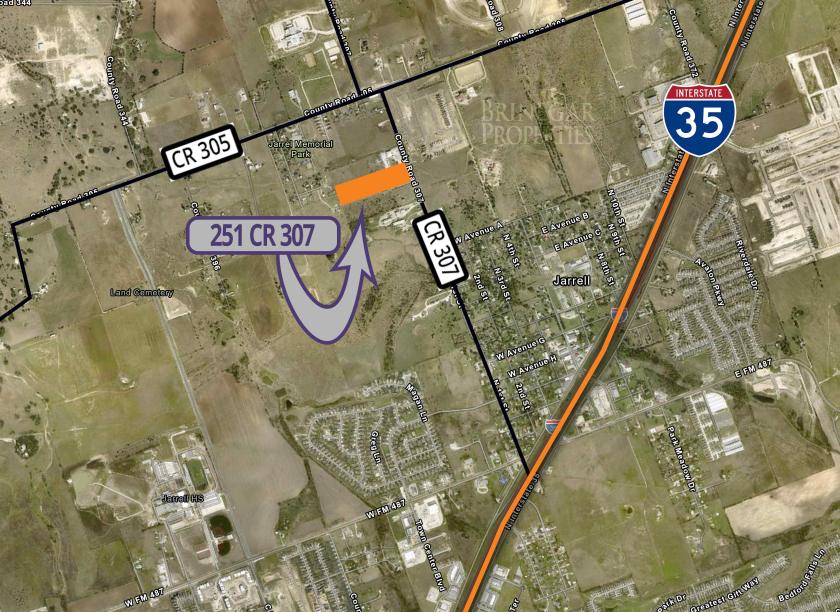
CR 307
Jarrell, TX 76537
IN CONTRACT - Development Land
Listing ID: 291481
- Property Type Land : Mixed Use Land
- Lot Size Acres 80.055
- Land Sq Ft 3,487,195


Property Highlights
• Ag exempt and ready for development
• Across CR 307 from new Jarrell ISD Elementary School #3 (Opening August 2023)
• Across street from under construction 400 unit single family residential housing development
• Jarrell ETJ
• Water onsite, sewer planned
• Agent has familial relationship with seller
Description
This 80.055-acre parcel, located in the Jarrell ETJ, boasts an agricultural exemption making it ready for the next phase. Situated across from the upcoming Jarrell ISD Elementary School #3 which opened in August 2023, its strategic positioning also benefits from being opposite a new 400-unit single-family residential development. With water already onsite and planned sewer connections, this land presents a lucrative prospect for visionary developers. The area's growth is evident, with population numbers steadily rising and a desirable average income for potential residents. Don't miss out on this exceptional investment opportunity! For more details, reach out to us today. Experience, expertise, and relationships - we are here to ensure your success in this flourishing market. Contact us at Brinegar Properties* and let's discuss how this property can be a part of your portfolio.
Attachments & Files
Listing Demographics
Information based on the most recently available data (updated annually) and is provided in 1-mile, 3-mile, and 5-mile radii (radiuses) of the property location.
| 1-Mile | 3-Miles | 5-Miles | ||
|---|---|---|---|---|
| Total Population | 381 | 3,990 | 7,419 | |
| Population Median Age | 37 | 33 | 35 | |
| Population by Age | 0-9 Yrs | 62 (16%) | 686 (17%) | 1087 (14%) |
| 10-19 Yrs | 49 (12%) | 535 (13%) | 1031 (13%) | |
| 20-29 Yrs | 39 (10%) | 574 (14%) | 1031 (13%) | |
| 30-39 Yrs | 54 (14%) | 717 (17%) | 1399 (18%) | |
| 40-49 Yrs | 41 (10%) | 486 (12%) | 879 (11%) | |
| 50-59 Yrs | 62 (16%) | 460 (11%) | 806 (10%) | |
| 60-69 Yrs | 48 (12%) | 318 (7%) | 665 (8%) | |
| 70+ Yrs | 27 (7%) | 214 (5%) | 521 (7%) | |
| Median HH Income | $88,927 | $80,915 | $80,158 | |
| Total Household Income | < 24K | 7 (5%) | 129 (10%) | 216 (9%) |
| 25-49K | 21 (17%) | 257 (20%) | 400 (17%) | |
| 50-74K | 16 (13%) | 190 (15%) | 446 (19%) | |
| 75-99K | 25 (21%) | 167 (13%) | 394 (17%) | |
| 100-199K | 44 (37%) | 438 (35%) | 698 (30%) | |
| 200K+ | 4 (3%) | 51 (4%) | 133 (5%) | |
| Highest Education Level | No Diploma | 39 | 356 | 689 |
| Diploma or GED | 40 | 701 | 1537 | |
| Some College | 41 | 594 | 1041 | |
| Assoc. Degree | 41 | 272 | 554 | |
| Bachelors Degree | 65 | 351 | 615 | |
| Higher Degree | 18 | 193 | 364 | |
| Total Housing Units | 135 | 1,379 | 2,492 | |
| --Owner-Occupied | 100 | 997 | 1,862 | |
| --Renter-Occupied | 18 | 235 | 425 | |
| Owner-Occupied Values | < 100K | 11 | 104 | 243 |
| 100-199K | 30 | 469 | 830 | |
| 200-299K | 41 | 313 | 528 | |
| 300-399K | 15 | 67 | 127 | |
| 400-499K | 2 | 21 | 53 | |
| 500K+ | 1 | 22 | 81 | |
| Total Working Age Population | 296 | 2,934 | 5,654 | |
| In Work Force | 190 | 2,057 | 3,906 | |
| Not In Work Force | 105 | 877 | 1,748 | |
| Workforce Employed | 179 | 1,979 | 3,750 | |
| Workforce Unemployed | 10 | 70 | 129 | |
| Civlian Workforce | 189 | 2,048 | 3,879 | |
| Military Workforce | 1 | 9 | 27 | |
| Total Households | 118 | 1,232 | 2,287 | |
| Family Households | 102 | 929 | 1,714 | |
| Non-Family Households | 16 | 303 | 572 | |
| Married Couple | 83 | 745 | 1,376 | |
| Other Family | 19 | 183 | 339 | |
| Married w/Child | 36 | 400 | 683 | |
| Single Male w/Child | 13 | 39 | 47 | |
| Single Female w/Child | 1 | 36 | 89 | |
Population Change Last Two Decades - Plus Projection
| 2000 | % | 2010 | % | 2020 | % | 2030 | |
|---|---|---|---|---|---|---|---|
| Texas | 20,851,820 | +21 | 25,145,561 | +18 | 29,677,668 | +18 | 34,894,452 |
| Bell County | 237,974 | +30 | 310,235 | +14 | 353,629 | +12 | 396,782 |
| Williamson County | 249,967 | +69 | 422,679 | +40 | 589,914 | +41 | 830,421 |
No part of this information may be copied, reproduced, repurposed, or screen-captured for any commercial purpose without prior written authorization from MyEListing.
While we strive to provide the most accurate information, all listing information, and demographic data, is provided by third-parties. As such, MyEListing will not be responsible for the accuracy of the information. It is strongly recommended that you verify all information with the listing agent, and any relevant agencies, prior to making any decisions.
Listing Location & Map Views
Listing Agent

Listing Co-Agent

More listings from Dan Mishler


Featured Vendors