101 East Huebinger Street
Marion, TX 78124
Listing ID: 298510
- Property Type Retail : Food Service
- Lot Size Acres 2.300
- Building Sq Ft 5,000
- Building Price per Sq Ft $300.00
- Land Sq Ft 100,187
- Land Price per Sq Ft $14.97


Property Highlights
• Outdoor Venue
• Liquor License
• Downtown, Historic
• Restaurant
• Warehouses
• Greenhouses
Description
Incredible location, directly across the street from 5A High School - downtown center, 1000s of homes surrounding.
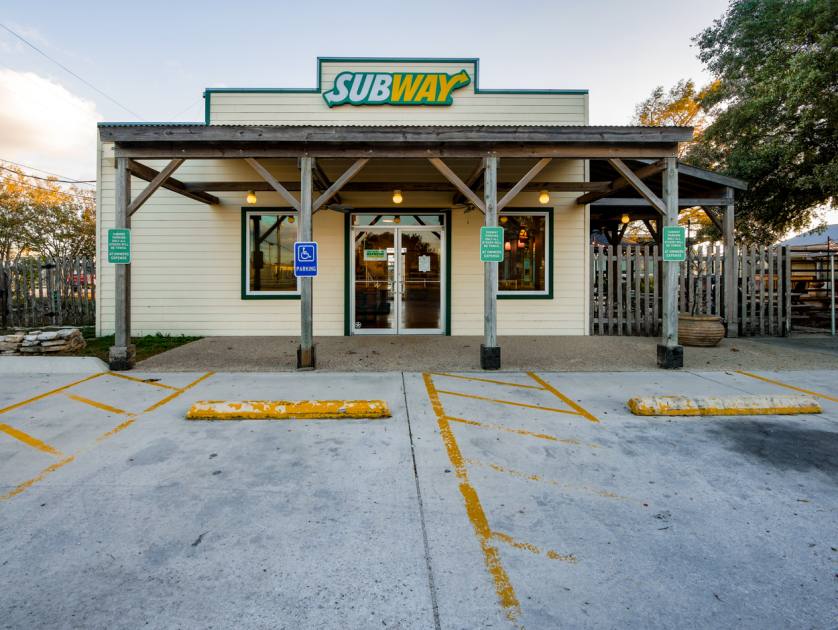
Restaurant fully equipped for fast-food service (former subway), bar with walk-in cooler/beer tap system installed, large outdoor music stage with tons of power and venue bathrooms. 3D tour here: https://my.matterport.com/show/?m=KphXexHXDfW
City water and sewer
2 warehouses and 5+ green houses from former Greenhouse/Nursery operation on site
Full 51% liquor license can convey.
Nearby Old Main Icehouse liquor sales available for sales comparison - tons of potential sales here for operator.
Attachments & Files
Listing Demographics
Information based on the most recently available data (updated annually) and is provided in 1-mile, 3-mile, and 5-mile radii (radiuses) of the property location.
| 1-Mile | 3-Miles | 5-Miles | ||
|---|---|---|---|---|
| Total Population | 697 | 4,750 | 16,363 | |
| Population Median Age | 43 | 39 | 35 | |
| Population by Age | 0-9 Yrs | 78 (11%) | 626 (13%) | 2552 (15%) |
| 10-19 Yrs | 91 (13%) | 641 (13%) | 2512 (15%) | |
| 20-29 Yrs | 58 (8%) | 482 (10%) | 1802 (11%) | |
| 30-39 Yrs | 72 (10%) | 631 (13%) | 2565 (15%) | |
| 40-49 Yrs | 92 (13%) | 669 (14%) | 2392 (14%) | |
| 50-59 Yrs | 92 (13%) | 589 (12%) | 1828 (11%) | |
| 60-69 Yrs | 111 (15%) | 590 (12%) | 1539 (9%) | |
| 70+ Yrs | 104 (14%) | 522 (10%) | 1172 (7%) | |
| Median HH Income | $64,753 | $70,272 | $82,481 | |
| Total Household Income | < 24K | 45 (16%) | 231 (13%) | 720 (13%) |
| 25-49K | 49 (17%) | 313 (18%) | 735 (13%) | |
| 50-74K | 99 (36%) | 380 (22%) | 924 (17%) | |
| 75-99K | 31 (11%) | 290 (17%) | 976 (18%) | |
| 100-199K | 43 (15%) | 383 (22%) | 1694 (31%) | |
| 200K+ | 7 (2%) | 78 (4%) | 293 (5%) | |
| Highest Education Level | No Diploma | 131 | 522 | 1314 |
| Diploma or GED | 194 | 1221 | 3234 | |
| Some College | 83 | 613 | 2348 | |
| Assoc. Degree | 54 | 412 | 1315 | |
| Bachelors Degree | 37 | 369 | 1576 | |
| Higher Degree | 16 | 143 | 767 | |
| Total Housing Units | 293 | 1,792 | 5,722 | |
| --Owner-Occupied | 233 | 1,494 | 4,661 | |
| --Renter-Occupied | 40 | 182 | 681 | |
| Owner-Occupied Values | < 100K | 89 | 446 | 929 |
| 100-199K | 57 | 459 | 1240 | |
| 200-299K | 43 | 251 | 1471 | |
| 300-399K | 20 | 169 | 573 | |
| 400-499K | 16 | 91 | 213 | |
| 500K+ | 8 | 79 | 234 | |
| Total Working Age Population | 583 | 3,773 | 12,277 | |
| In Work Force | 298 | 2,256 | 7,909 | |
| Not In Work Force | 285 | 1,517 | 4,368 | |
| Workforce Employed | 286 | 2,135 | 7,246 | |
| Workforce Unemployed | 9 | 96 | 453 | |
| Civlian Workforce | 295 | 2,231 | 7,699 | |
| Military Workforce | 3 | 25 | 210 | |
| Total Households | 273 | 1,676 | 5,341 | |
| Family Households | 199 | 1,239 | 4,113 | |
| Non-Family Households | 74 | 437 | 1,228 | |
| Married Couple | 170 | 989 | 3,223 | |
| Other Family | 28 | 251 | 890 | |
| Married w/Child | 55 | 394 | 1,540 | |
| Single Male w/Child | 1 | 6 | 77 | |
| Single Female w/Child | 13 | 113 | 315 | |
Population Change Last Two Decades - Plus Projection
| 2000 | % | 2010 | % | 2020 | % | 2030 | |
|---|---|---|---|---|---|---|---|
| Texas | 20,851,820 | +21 | 25,145,561 | +18 | 29,677,668 | +18 | 34,894,452 |
| Guadalupe County | 89,023 | +48 | 131,533 | +29 | 170,266 | +30 | 221,353 |
No part of this information may be copied, reproduced, repurposed, or screen-captured for any commercial purpose without prior written authorization from MyEListing.
While we strive to provide the most accurate information, all listing information, and demographic data, is provided by third-parties. As such, MyEListing will not be responsible for the accuracy of the information. It is strongly recommended that you verify all information with the listing agent, and any relevant agencies, prior to making any decisions.
Listing Location & Map Views
Listing Agent

Featured Vendors
• SUPPORT THIS FREE PLATFORM •
The below vendors allow the platform to be provided at no cost. Please consider their
services when needed.
services when needed.
• Cleaning Company •
A clean, sanitized office is here!
• Environmental Studies •
Get an Environmental Site Survey!