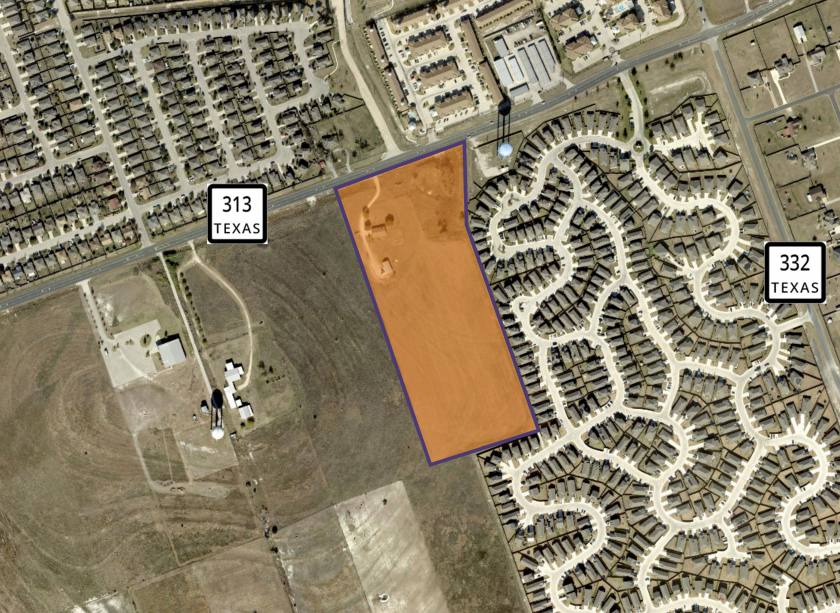
550 County Road 314
Jarrell, TX 76537
Listing ID: 299137
- Property Type Land : Agricultural Land
- Lot Size Acres 11.000
- Land Sq Ft 479,160
- Land Price per Sq Ft $3.13


Property Highlights
• Development Site
• 11 Acres
• No Zoning
• Less Than 1 Mile to IH-35
• Possibilities Include Multi-family, Storage, Warehouse, Church, Etc.
Description
Located at 550 County Road 314, this incredible property offers endless possibilities with its prime location and flexible zoning options. Situated less than 1 mile from IH-35, this 11-acre site is perfect for a variety of uses including multi-family housing, storage facilities, warehouses, churches, and more. The lack of zoning restrictions opens up a world of opportunities for investors and developers looking to make their mark in this growing area. Not only does this property offer unlimited potential, but it also boasts proximity to neighboring towns such as Salado, Florence, Georgetown, Belton, and Temple.
With population growth rates on the rise and an average household income exceeding $91,000, this vibrant community presents a lucrative market for investors. Don't miss out on the chance to own this remarkable development site in Jarrell. Take advantage of this incredible opportunity to create something truly special at 550 County Road 314.
Attachments & Files
Listing Demographics
Information based on the most recently available data (updated annually) and is provided in 1-mile, 3-mile, and 5-mile radii (radiuses) of the property location.
| 1-Mile | 3-Miles | 5-Miles | ||
|---|---|---|---|---|
| Total Population | 984 | 5,448 | 7,682 | |
| Population Median Age | 33 | 33 | 35 | |
| Population by Age | 0-9 Yrs | 130 (13%) | 890 (16%) | 1149 (14%) |
| 10-19 Yrs | 144 (14%) | 707 (12%) | 939 (12%) | |
| 20-29 Yrs | 164 (16%) | 863 (15%) | 1139 (14%) | |
| 30-39 Yrs | 266 (27%) | 1204 (22%) | 1557 (20%) | |
| 40-49 Yrs | 83 (8%) | 621 (11%) | 907 (11%) | |
| 50-59 Yrs | 77 (7%) | 504 (9%) | 810 (10%) | |
| 60-69 Yrs | 66 (6%) | 400 (7%) | 724 (9%) | |
| 70+ Yrs | 54 (5%) | 258 (4%) | 456 (5%) | |
| Median HH Income | $72,446 | $72,884 | $75,356 | |
| Total Household Income | < 24K | 19 (6%) | 168 (10%) | 239 (10%) |
| 25-49K | 35 (11%) | 320 (19%) | 444 (19%) | |
| 50-74K | 103 (34%) | 351 (21%) | 446 (19%) | |
| 75-99K | 81 (27%) | 277 (17%) | 414 (18%) | |
| 100-199K | 50 (16%) | 449 (27%) | 600 (26%) | |
| 200K+ | 9 (3%) | 60 (3%) | 128 (5%) | |
| Highest Education Level | No Diploma | 113 | 516 | 732 |
| Diploma or GED | 231 | 1172 | 1682 | |
| Some College | 107 | 774 | 1060 | |
| Assoc. Degree | 101 | 399 | 580 | |
| Bachelors Degree | 57 | 364 | 632 | |
| Higher Degree | 39 | 225 | 332 | |
| Total Housing Units | 301 | 1,764 | 2,470 | |
| --Owner-Occupied | 248 | 1,323 | 1,845 | |
| --Renter-Occupied | 49 | 303 | 426 | |
| Owner-Occupied Values | < 100K | 13 | 113 | 221 |
| 100-199K | 143 | 707 | 848 | |
| 200-299K | 76 | 388 | 500 | |
| 300-399K | 8 | 60 | 136 | |
| 400-499K | 0 | 7 | 30 | |
| 500K+ | 9 | 49 | 109 | |
| Total Working Age Population | 770 | 4,079 | 5,921 | |
| In Work Force | 565 | 2,954 | 4,143 | |
| Not In Work Force | 206 | 1,125 | 1,777 | |
| Workforce Employed | 548 | 2,874 | 4,022 | |
| Workforce Unemployed | 11 | 67 | 105 | |
| Civlian Workforce | 559 | 2,941 | 4,127 | |
| Military Workforce | 6 | 13 | 16 | |
| Total Households | 297 | 1,626 | 2,271 | |
| Family Households | 208 | 1,152 | 1,661 | |
| Non-Family Households | 89 | 474 | 610 | |
| Married Couple | 151 | 888 | 1,313 | |
| Other Family | 57 | 264 | 348 | |
| Married w/Child | 83 | 494 | 646 | |
| Single Male w/Child | 0 | 13 | 39 | |
| Single Female w/Child | 26 | 82 | 86 | |
Population Change Last Two Decades - Plus Projection
| 2000 | % | 2010 | % | 2020 | % | 2030 | |
|---|---|---|---|---|---|---|---|
| Texas | 20,851,820 | +21 | 25,145,561 | +18 | 29,677,668 | +18 | 34,894,452 |
| Bell County | 237,974 | +30 | 310,235 | +14 | 353,629 | +12 | 396,782 |
| Williamson County | 249,967 | +69 | 422,679 | +40 | 589,914 | +41 | 830,421 |
No part of this information may be copied, reproduced, repurposed, or screen-captured for any commercial purpose without prior written authorization from MyEListing.
While we strive to provide the most accurate information, all listing information, and demographic data, is provided by third-parties. As such, MyEListing will not be responsible for the accuracy of the information. It is strongly recommended that you verify all information with the listing agent, and any relevant agencies, prior to making any decisions.
Listing Location & Map Views
Listing Agent

More listings from Brentley Brinegar


Featured Vendors
• SUPPORT THIS FREE PLATFORM •
The below vendors allow the platform to be provided at no cost. Please consider their
services when needed.
services when needed.
• Title Company •
Talk to an escrow officer today!
• Dumpster Service •
Dumpsters delivered to your door!
• Roofing Contractor •
Repair, replace, maintain. Click here!