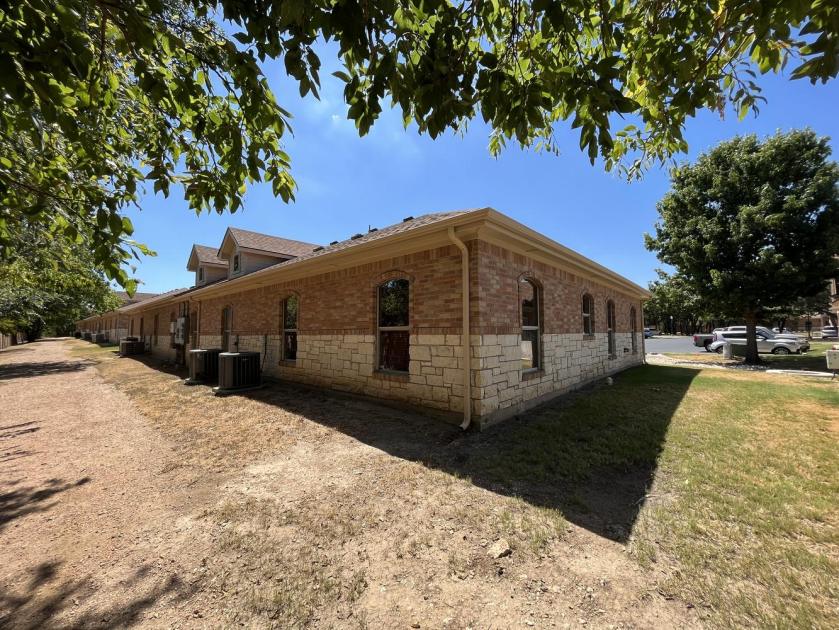
3613 Williams Drive
Georgetown, TX 78628
Village Lakes Office Condo 601
Listing ID: 310428
- Property Type Office : Professional
- Lot Size Acres 0.100
- Building Sq Ft 1,000
- Building Price per Sq Ft $348.00
- Land Sq Ft 4,356
- Land Price per Sq Ft $79.89

Description
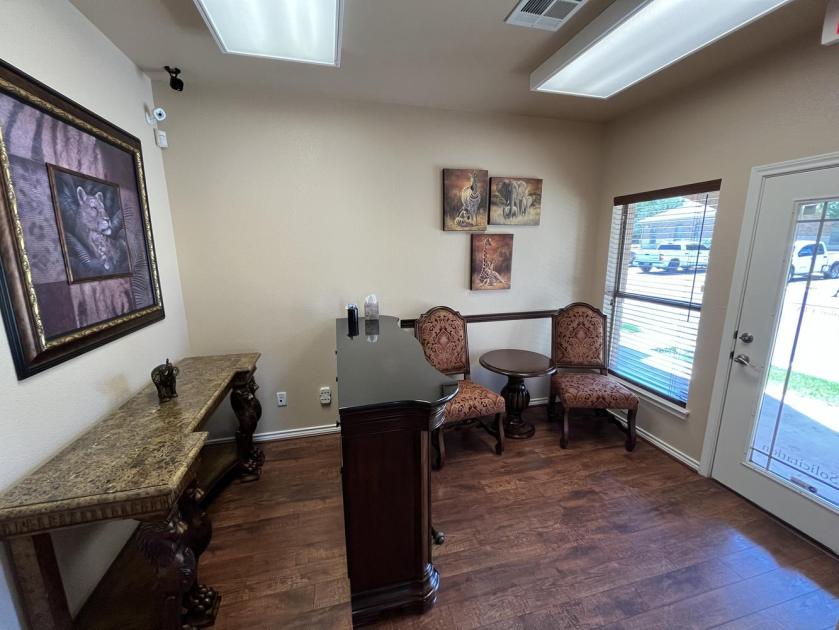
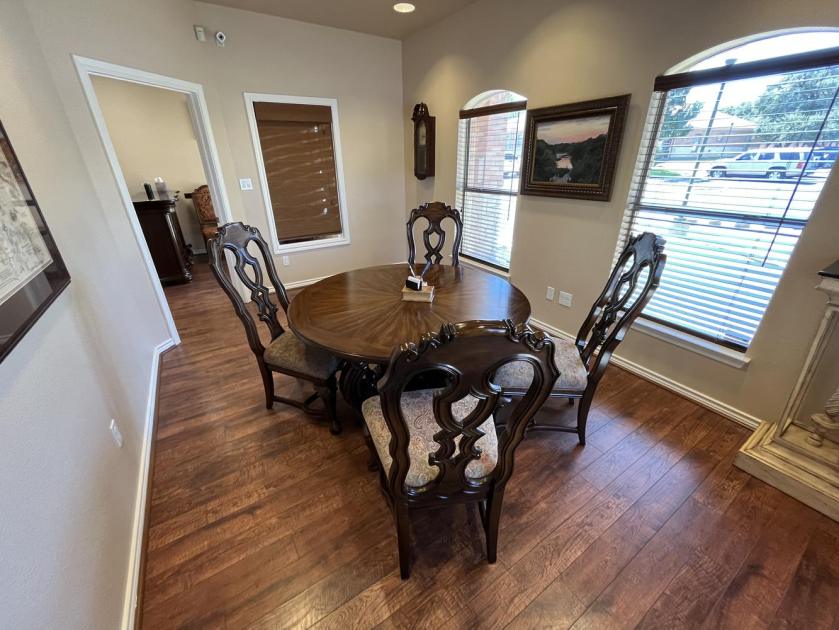
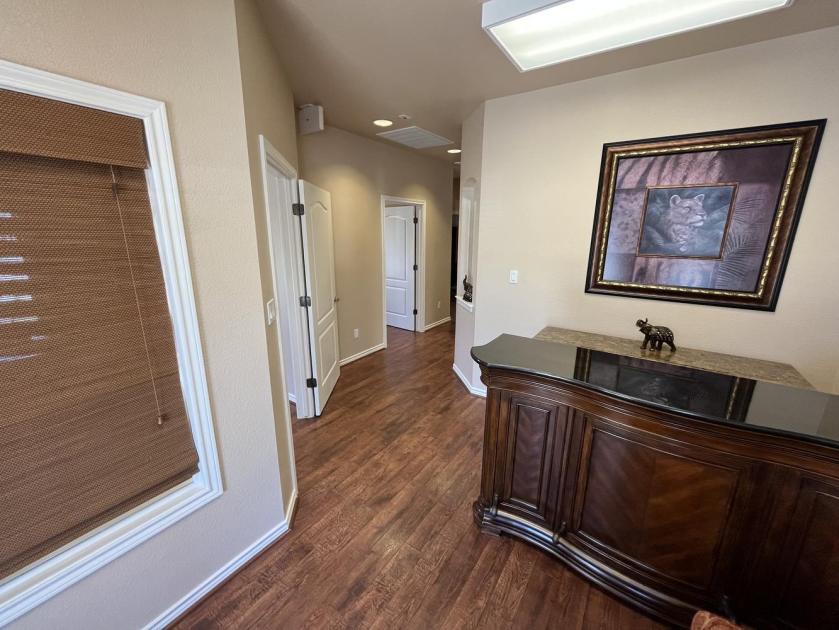
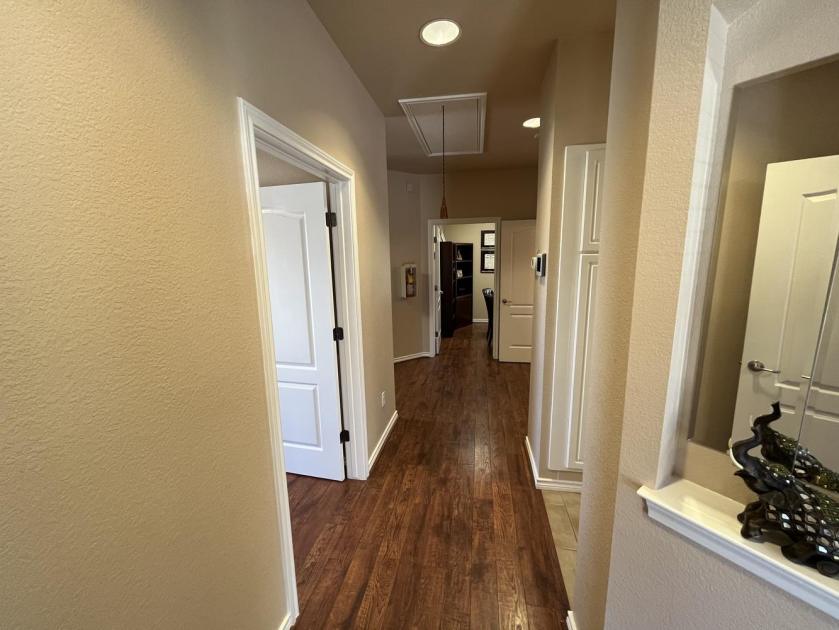
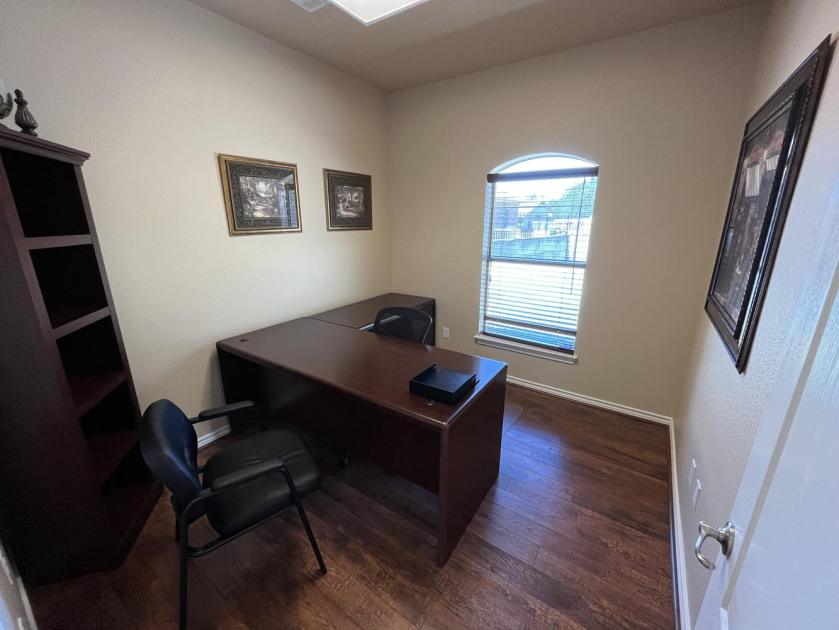
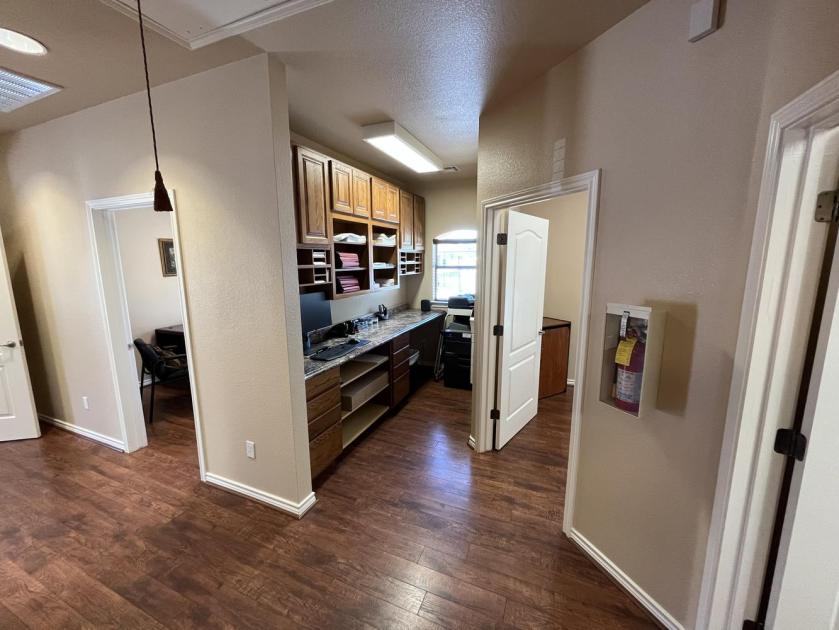
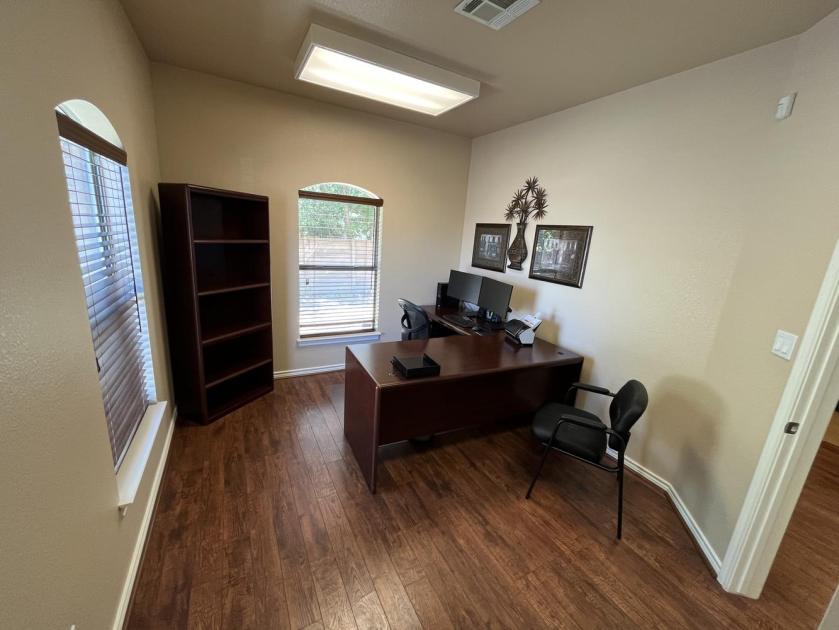
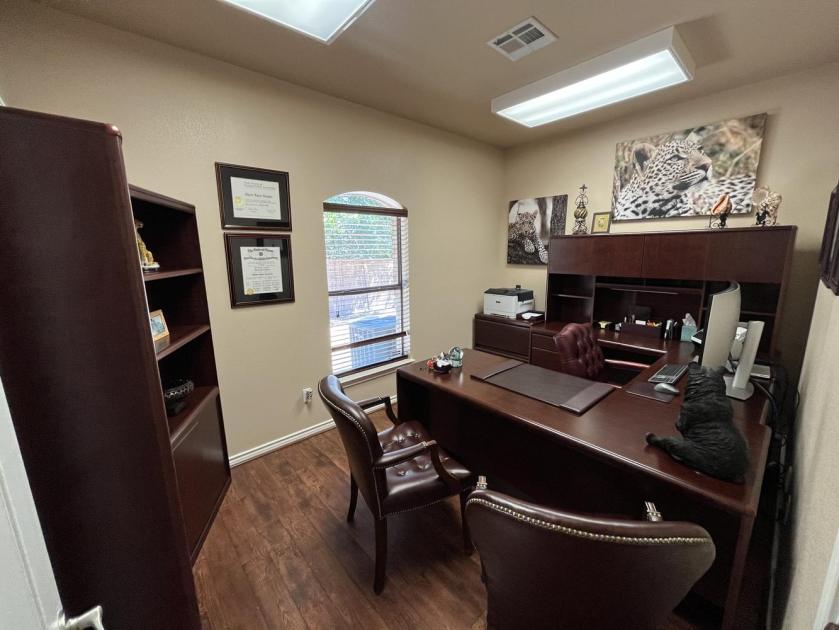
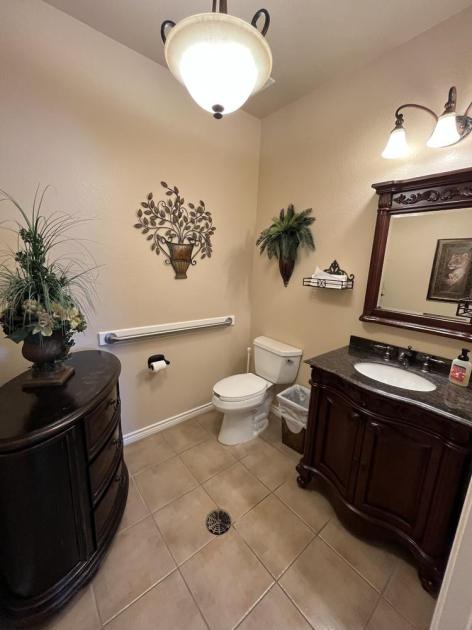
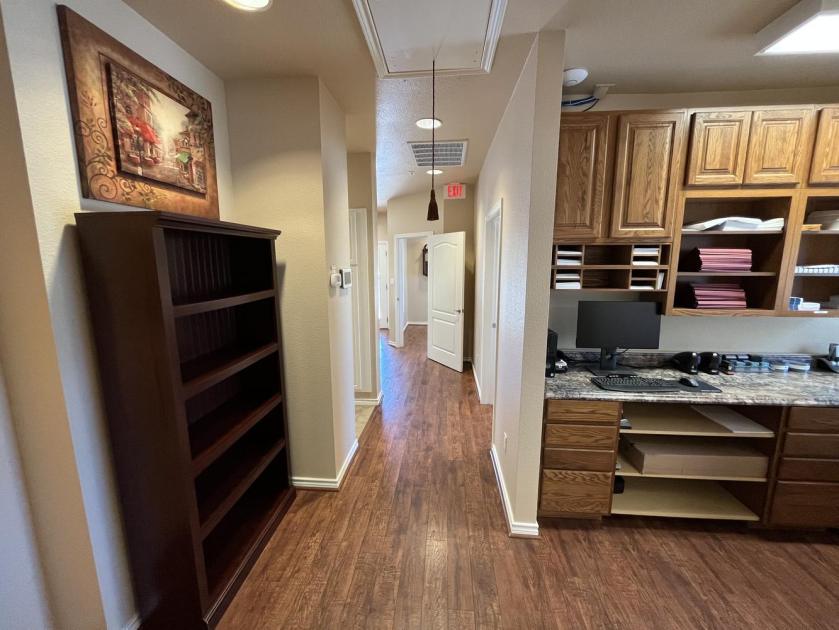
Corner unit with windows and natural light in all all offices and workstations. This unit has been upgraded with hardwood floors, remodeled restroom, security system, and expansive built in cabinetry in the kitchen and copy area. The efficient office layout features a reception area, private restroom, kitchen, copy/file area and 3 offices + conference room.
Furniture is also available for purchase.
Attachments & Files
Listing Demographics
Information based on the most recently available data (updated annually) and is provided in 1-mile, 3-mile, and 5-mile radii (radiuses) of the property location.
| 1-Mile | 3-Miles | 5-Miles | ||
|---|---|---|---|---|
| Total Population | 7,501 | 36,756 | 72,410 | |
| Population Median Age | 41 | 42 | 45 | |
| Population by Age | 0-9 Yrs | 1023 (13%) | 3798 (10%) | 7094 (9%) |
| 10-19 Yrs | 1311 (17%) | 5802 (15%) | 9176 (12%) | |
| 20-29 Yrs | 492 (6%) | 3456 (9%) | 6603 (9%) | |
| 30-39 Yrs | 619 (8%) | 3956 (10%) | 7078 (9%) | |
| 40-49 Yrs | 1078 (14%) | 4263 (11%) | 8781 (12%) | |
| 50-59 Yrs | 603 (8%) | 4595 (12%) | 8351 (11%) | |
| 60-69 Yrs | 1093 (14%) | 5020 (13%) | 11033 (15%) | |
| 70+ Yrs | 1283 (17%) | 5868 (15%) | 14295 (19%) | |
| Median HH Income | $64,089 | $81,424 | $83,258 | |
| Total Household Income | < 24K | 353 (14%) | 1544 (12%) | 3156 (11%) |
| 25-49K | 535 (22%) | 2121 (16%) | 4316 (16%) | |
| 50-74K | 623 (25%) | 2376 (18%) | 4639 (17%) | |
| 75-99K | 337 (13%) | 1489 (11%) | 4018 (14%) | |
| 100-199K | 401 (16%) | 3803 (29%) | 8031 (29%) | |
| 200K+ | 173 (7%) | 1515 (11%) | 2717 (10%) | |
| Highest Education Level | No Diploma | 286 | 1681 | 3354 |
| Diploma or GED | 1486 | 5506 | 10559 | |
| Some College | 1098 | 5681 | 11537 | |
| Assoc. Degree | 414 | 1649 | 3809 | |
| Bachelors Degree | 1221 | 7270 | 14818 | |
| Higher Degree | 476 | 3687 | 8711 | |
| Total Housing Units | 2,670 | 13,603 | 28,138 | |
| --Owner-Occupied | 1,351 | 8,719 | 20,507 | |
| --Renter-Occupied | 1,070 | 4,130 | 6,370 | |
| Owner-Occupied Values | < 100K | 47 | 183 | 561 |
| 100-199K | 217 | 1013 | 1959 | |
| 200-299K | 657 | 3107 | 7966 | |
| 300-399K | 271 | 2482 | 5614 | |
| 400-499K | 31 | 897 | 2001 | |
| 500K+ | 128 | 1038 | 2405 | |
| Total Working Age Population | 5,581 | 29,693 | 60,138 | |
| In Work Force | 3,106 | 15,847 | 31,020 | |
| Not In Work Force | 2,475 | 13,846 | 29,118 | |
| Workforce Employed | 2,601 | 14,542 | 28,890 | |
| Workforce Unemployed | 501 | 1,248 | 2,023 | |
| Civlian Workforce | 3,102 | 15,790 | 30,914 | |
| Military Workforce | 3 | 57 | 107 | |
| Total Households | 2,421 | 12,848 | 26,876 | |
| Family Households | 1,715 | 9,069 | 18,961 | |
| Non-Family Households | 706 | 3,779 | 7,915 | |
| Married Couple | 1,349 | 7,510 | 16,002 | |
| Other Family | 365 | 1,560 | 2,959 | |
| Married w/Child | 485 | 2,379 | 4,399 | |
| Single Male w/Child | 77 | 214 | 333 | |
| Single Female w/Child | 172 | 680 | 1,242 | |
Population Change Last Two Decades - Plus Projection
| 2000 | % | 2010 | % | 2020 | % | 2030 | |
|---|---|---|---|---|---|---|---|
| Texas | 20,851,820 | +21 | 25,145,561 | +18 | 29,677,668 | +18 | 34,894,452 |
| Williamson County | 249,967 | +69 | 422,679 | +40 | 589,914 | +41 | 830,421 |
No part of this information may be copied, reproduced, repurposed, or screen-captured for any commercial purpose without prior written authorization from MyEListing.
While we strive to provide the most accurate information, all listing information, and demographic data, is provided by third-parties. As such, MyEListing will not be responsible for the accuracy of the information. It is strongly recommended that you verify all information with the listing agent, and any relevant agencies, prior to making any decisions.
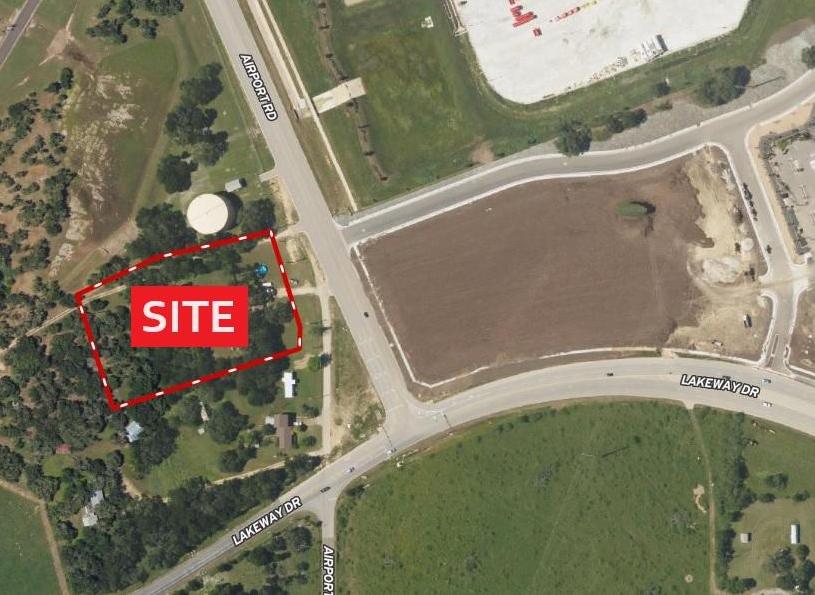
Listing Location & Map Views
Listing Agent

More listings from Mason Turner


Featured Vendors